The LYRA instrument onboard the Proba2 spacecraft registers UV and EUV irradiance using 4 different filters. Calibrated level 2 and level 3 (1 minute averaged) data are available in daily FITS-files as well as level 4 calibrated daily PNG plots. The LYRA Rescaled data provide rescaled values from the Aluminium and Zirconium channels which have been cross-calibrated with GOES X-ray data in order to provide a proxy for X-ray flare intensity. The rescaled data are available in daily TEXT files as well as daily PNG plots.
Select LYRA data products.
This web page forms part of the European Space Agency's network of space weather services and service development
activities, and is supported under ESA contract number 4000134036/21/D/MRP.
For further product-related information
or enquiries contact helpdesk. E-mail: helpdesk.swe@esa.int
The LYRA instrument is developed in a project of the Centre Spatial de Liege, the Physikalisch-Meteorologisches Observatorium Davos and the Royal Observatory of Belgium funded by the Belgian Federal Science Policy Office (BELSPO, PRODEX grant C90209) and by the Swiss Bundesamt für Bildung und Wissenschaft. The PROBA2 SOC at the Royal Observatory of Belgium is currently operated under ESA contract 22653/09/NL/NR “Science Operations support and assistance for PROBA-2 Science Center”. The data contained in the present page are Intellectual Property of the Royal Observatory of Belgium (ROB). Use of the data is restricted by the ROB data policy.
API Access Proba2/LYRA Data
Introduction
This product can also be used via a Web API (application programming interface) for programmatically accessing the images by requesting specific URL-encoded parameters.
The list of mandatory and optional variables for this specific product are included in tables 1 and 2 below:
Variable
Values required for this product
pc
S102
psc
a
component
latest | archive
Table 1: Mandatory parameters for API access to Proba2/LYRA data.
Variable
Values
dts_start, dts_end
yyyy-MM-ddTHH:mm:ssZ
level
2 | 3 | 4 (default)
Table 2: Optional parameters that can be set to refine the query.
To access the archived data, the "component" parameter in the API URL should be set to "archive" (component=archive).
The URL is as follows: https://ssa.sidc.be/prod/API/index.php?component=archive&pc=S102&psc=a
returns a JSON containing a list of the last 4 PNG plots for the level 4 data.
PROBA2 (PRoject for Onboard Autonomy 2) is an ESA micro-satellite that was launched 2 November 2009
with a scientific mission to explore the active Sun and its effect on the near-earth environment.
PROBA2 carries two solar instruments; SWAP (Sun Watcher using Active Pixel system detector and Image Processing,
see Proba2/SWAP Data)
and LYRA (Large Yield RAdiometer, formerly LYman alpha RAdiometer). These instruments are used to identify
and study all events on the Sun that might have implications on the solar-terrestrial connection,
both through imaging (SWAP) as well as through irradiance measurements (LYRA)
The data are downloaded at ESA’s Spacecraft Operation Centre in Redu. The PROBA2 Science Centre (P2SC), at the Royal Observatory of Belgium,
oversees scientific operations and data processing for the SWAP and LYRA instruments.
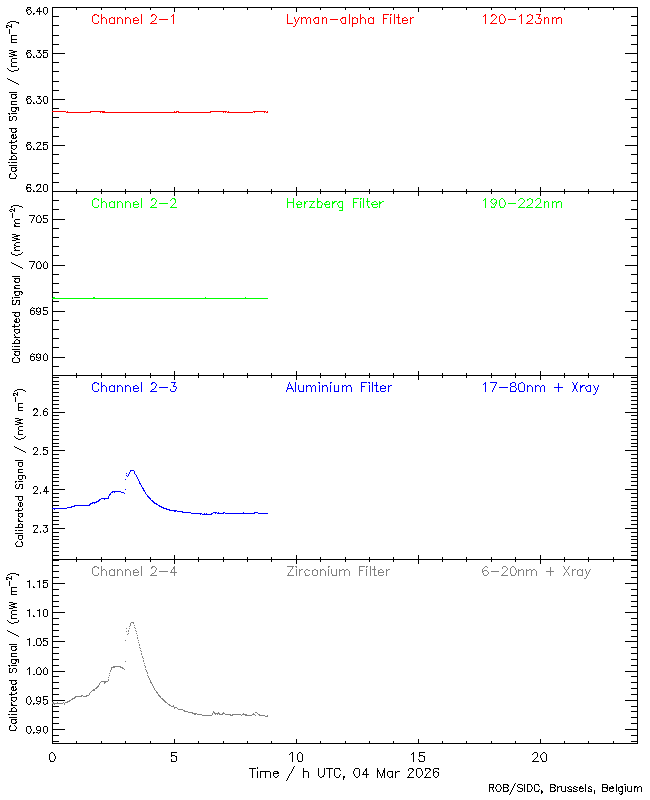
LYRA is an ultraviolet irradiance radiometer that observes the Sun in four passbands, chosen for their relevance to solar physics, aeronomy and space weather:
120-123 nm - Lyman-α channel
190-222 nm - Herzberg continuum channel
Aluminium filter channel (17-80 nm + a contribution below 5 nm), including the strong He II at 30.4 nm
Zirconium filter channel (6-20 nm + a contribution below 2 nm), rejecting He II
This instrument can detect solar flares and analyse the atmospheric composition of the Earth. Solar flares are one of the most energetic phenomena in the solar system.
During these events, particles can be heated to millions of degrees and ejected in the solar atmosphere. Therefore, detecting and analysing solar flares is directly relevant for space weather.
These events appear in radiometer time series as an increase of the solar irradiance, especially in X-ray and UV ranges, for an example of how the LYRA data appears during a series of flares see figure 1.
LYRA benefits of a very favourable acquisition cadence (up to 100Hz) while other solar instruments such as GOES have acquisition rates on the order of tens of seconds.
A cadence this high helps understand the detailed chronology of the flaring process.
Figure 1: Example LYRA plot during a series of flares of various amplitudes on 29 May 2020. The flares are hardly visible in channels 1 and 2 but can be seen clearly in channels 3 and 4.
Technical information
LYRA data are processed, calibrated, and prepared into several "levels". The data are available from the beginning of the scientific mission in March 2010 (although most data since launch on November 2009 are available as well).
LYRA raw 'standard' time curves, Level 1, are a set of metadata and uncalibrated data daily FITS files. The level 1 data are not provided here.
Level 2 corresponds to the calibrated data, provided as daily FITS files.
Level 3 provides, as level 2, calibrated data, but averaged over 1 minute.
Level 4 corresponds to LYRA daily PNG files from the short wavelength channels 17-80 nm and 6-20 nm.
Lyra Rescaled data provides rescaled values from the Aluminium and Zirconium channels which have been cross-calibrated with GOES X-ray data in order to provide a proxy for X-ray flare intensity.
This product provides level 2 and 3 FITS files as well as level 4 PNG files. The rescaled data are available in daily text files as well as daily PNG plots.
The text file is in ASCII and the format is described in the file as comments.
Limitations and caveats of the data
"Calibrated" currently means that the dark currents were subtracted, the trend due to instrumental degradation was removed, solar values were normalized to 1AU, and the LYRA count rates were converted to physical units with the aid of a comparison to other instruments on LYRA's First Light Day. Daily and orbital variations of the channels due to on-board temperature changes were corrected using the HK temperatures contained in the Level-1-metadata FITS file. The curves still include four regular disturbances per orbit due to spacecraft rotations, and possible disturbances due to commanding. Gaps may be caused by missing downlinks or calibration campaigns.
From November to January, PROBA2 experiences "eclipse season". For several minutes during each orbit, the solar disk is occulted by the Earth, and the observed irradiance's decrease to dark-current levels - thus the strange comb-like shape of the curves.
Use and functionality of the product
By default the Latest tab displays the most recent level 4 PNG plot. It is possible to switch to the other data levels via the drop-down menu above the data by choosing the required data and clicking select.
For level 2 and level 3, the timestamp, the filename and the size of the corresponding file in kB is displayed.
For level 4, the latest PNG plot is displayed.
For the LYRA Rescaled data, the latest PNG plot is displayed with the link to the data ASCII file provided
above the plot with the size of the file given in kB. The format of the data file is described in the file as comments.
By default the Query tab displays a table with links to the last 4 archived level 4 PNG plots. It is possible to switch to the other data levels in the same way as described above.
The lists give the time and date, filename and size in kB for each of the files.
For level 2 and level 3, the archived calibrated daily FITS files are available going back to the start of the mission.
For level 4, the archived daily PNG plots are available going back to the start of the mission.
For the LYRA Rescaled data all of the archived daily data ASCII files and PNG plots are available. The format of the data files are described in the files as comments.
The lists can be filtered by providing a start and end date in the format yyyy-MM-ddTHH:mm:ssZ.
For example, entering the start date 2020-11-27T00:00:00Z and end date 2020-11-30T00:00:00Z and clicking submit
will return a list of all of the files available from 27 November 2020 to 30 November 2020.
All levels of the latest and archival data are also provided via an API. For more information on how to access the data via the API see Help/API access.
The top menu navigation bar allows to browse through the products (across the different "Solar Weather" providers) as follows:
Help: Provides more details on the data products, their properties, constraints and access methods, the providing Expert Group as well as this general help on navigation.
Similar products: Navigate to products offering the same type of data but from other providers/instruments.
Related products: Navigate to products that are related in the sense that e.g. one product provides input to the other, or one product is the forecast of the quantity which is measured in the other product.
Latest: Switch to page showing the latest data.
Query: Switch to page offering archive query functionalities.
Email Subscription: Switch to page for email subscription of service.